
Understanding analytics for small business is the practice of deliberately measuring, capturing, and maintaining trustworthy data to inform decisions that drive profitability and growth. Analytics is not a tool you buy. It is a discipline requiring judgment and workflow integration to produce real impact. Small and midsize data-driven businesses are up to 20% more likely to meet revenue targets than those relying on intuition alone. That gap is not about software. It is about whether you have a repeatable system for turning numbers into decisions.
What are the core components of small business analytics?
Analytics rests on three fundamental components: Measurement, Instrumentation, and Hygiene. Neglecting these three leads to expensive, unused software and decisions made on bad data. Most small business owners skip straight to picking a tool. That is the wrong starting point.
Measurement is the practice of deciding which numbers inform specific decisions. Before you track anything, you need to answer one question: what decision will this number help me make? If you cannot answer that, the metric is not worth tracking. A nail salon owner, for example, does not need to track 40 website metrics. She needs to know which pages drive appointment bookings.

Instrumentation is how you capture data accurately at the source. A form that fires a conversion event only 60% of the time gives you data that looks real but is not. Broken tracking is worse than no tracking because it creates false confidence. Setting up Google Tag Manager correctly, verifying that your contact form fires a confirmation event, and confirming that your Google Business Profile is linked to your analytics account are all instrumentation tasks.
Hygiene is the ongoing work of keeping data trustworthy as your business changes. You add a new service page. You change your booking software. You run a promotion. Each of these events can corrupt your historical data if you do not document and adjust your tracking. Hygiene is not glamorous, but it is what separates businesses that trust their data from those that argue about it in meetings.
- Measurement: define what each metric must answer before you track it
- Instrumentation: verify that every data capture point fires correctly
- Hygiene: audit your tracking setup every quarter or after any major site change
Pro Tip: Set a calendar reminder every 90 days to run a basic tracking audit. Check that your top five conversion events still fire correctly. This single habit prevents months of corrupted data.
Which metrics should small businesses track?
Tracking fewer metrics consistently delivers far more useful insights than tracking many metrics sporadically. Analysis paralysis is real, and it kills momentum. The goal is a short list of metrics you actually review and act on every week.
For most small businesses, these five web metrics cover the essentials:
- Total visits — the raw count of sessions on your site, which tells you whether your traffic is growing or shrinking over time
- Traffic sources — where visitors come from (organic search, Google Business Profile, social, direct), which shows which marketing channels are working
- Top pages — which pages get the most visits, revealing what your audience actually wants from your site
- Conversion rate — the percentage of visitors who take a target action, such as calling, booking, or submitting a form
- Engagement rate — the share of sessions where visitors interact meaningfully, which signals content quality and relevance
| Metric | What it tells you | Review frequency |
|---|---|---|
| Total visits | Overall traffic trend | Weekly |
| Traffic sources | Channel effectiveness | Weekly |
| Top pages | Content demand | Monthly |
| Conversion rate | Marketing efficiency | Weekly |
| Engagement rate | Content quality | Monthly |
Consistency matters more than completeness. A business that reviews five metrics every week for six months will make better decisions than one that tracks 30 metrics and checks them once a quarter. Spending just 15 minutes per week reviewing these trends is enough to catch problems early and spot opportunities before they pass.
Pro Tip: Block 15 minutes every Monday morning to review your five core metrics. Write down one observation and one action for the week. This turns data review from a passive habit into a decision-making practice.
How do you interpret analytics to find growth opportunities?
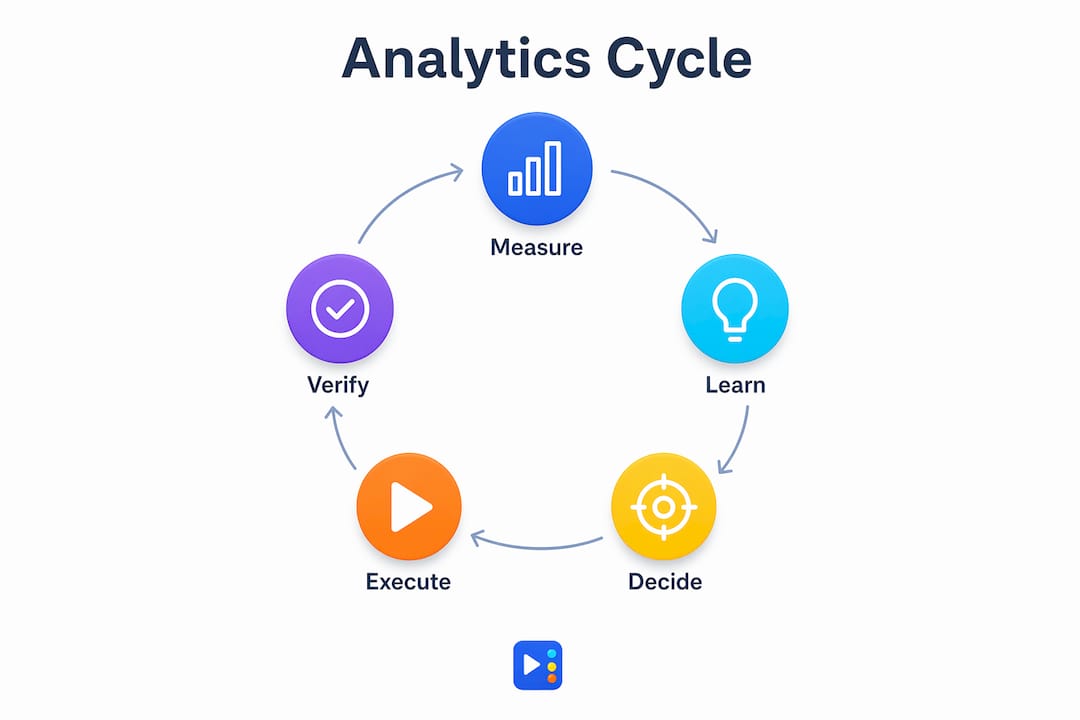
Interpreting data well requires a repeatable cycle, not a one-time analysis. The growth analytics cycle consists of five steps: measure, learn, decide, execute, and verify. Each step feeds the next. Skipping "verify" is the most common mistake. Owners make a change and never confirm whether it worked.
Trend analysis over time beats point-in-time snapshots. A single week of low traffic means nothing. Four weeks of declining traffic from organic search means your local SEO needs attention. Evaluating conversion rates by traffic source over at least four weeks is the minimum for reliable decision-making. Shorter time frames produce noise, not signal.
Here is how to apply this in practice:
- Spot conversion drop-offs: If your top page has high traffic but a low conversion rate, the page content or call to action is the problem, not your marketing spend.
- Identify bottlenecks: If organic traffic is growing but bookings are flat, your booking flow has friction. Check the steps between landing and confirmation.
- Adjust pricing signals: If your pricing page has a high exit rate, visitors are leaving without converting. Test clearer pricing language or a visible phone number.
- Connect channels to outcomes: If your Google Business Profile drives 40% of your calls but you have not updated it in a year, that is your highest-return task this week. Yourlocalseo helps businesses track local SEO results and connect those results to real revenue decisions.
"The ultimate goal of analytics is not producing reports. It is creating an action loop that connects metrics to decisions and outcomes." — Scoop Analytics
Avoid evaluating any single metric in isolation. A high conversion rate on a traffic source that costs three times more than another is not a win. Always pair conversion data with cost and volume context before drawing conclusions.
What steps help small business owners implement analytics?
Starting an analytics practice does not require a data team or an enterprise budget. It requires clarity, a simple setup, and a weekly rhythm. Successful analytics strategies start by working backward from explicit business goals to define which data matters.
Follow these steps to build your practice from scratch:
- Define your top three business goals. Write them down. Examples: increase appointment bookings by 20%, grow organic traffic from Austin searches, reduce cost per lead. Every metric you track must connect to one of these goals.
- Set up instrumentation for your key conversion events. Confirm that your contact form, booking button, and phone click all fire tracking events. Use a free tool like Google Tag Manager to manage this without touching your site code.
- Choose a simple, privacy-friendly analytics tool. Simple tools that people actually use beat complex platforms that collect data nobody reviews. Pick one and commit to it for at least six months.
- Build a weekly Growth Scoreboard. A consistent weekly review with 10–12 metrics and a 45-minute meeting improves business responsiveness and supports scaling decisions. For solo owners, a simple spreadsheet with five metrics works just as well.
- Set data governance rules. Decide who can access your analytics account, who can make changes, and how you document those changes. This protects data integrity and prevents accidental overwrites.
Pro Tip: Before adding any new tool to your stack, ask one question: "Will I review the data this produces every week?" If the answer is no, skip it. Tool overload is the fastest way to abandon your analytics practice entirely.
The SEO reporting practices used by Central Texas businesses offer a practical model for small business owners building their first reporting rhythm. Clear, consistent reports tied to specific goals are what separate businesses that grow from those that stay stuck.
Key Takeaways
Small business analytics succeeds when it is treated as a discipline built on measurement, instrumentation, and hygiene rather than a tool purchase.
| Point | Details |
|---|---|
| Analytics is a discipline | Buying software without measurement and hygiene practices produces unused data and bad decisions. |
| Track five core metrics | Total visits, traffic sources, top pages, conversion rate, and engagement rate cover most small business needs. |
| Review weekly, not daily | A 15-minute weekly review of consistent metrics beats daily monitoring of inconsistent data. |
| Use the growth cycle | Measure, learn, decide, execute, and verify every change to build a real action loop. |
| Start with business goals | Define your top three goals first, then build your tracking setup to answer questions those goals require. |
Why most small businesses get analytics backwards
I have worked with enough small business owners to see the same pattern repeat. They buy an analytics tool, get excited about dashboards for two weeks, and then stop looking at the data entirely. The tool was not the problem. The missing piece was always a clear question the data was supposed to answer.
The businesses that actually use their data well do something counterintuitive. They start with less. They pick three metrics, review them every Monday, and write down one decision per week based on what they see. That discipline compounds over time. Six months in, they have a clear picture of what drives their revenue. A year in, they are making faster, more confident decisions than competitors who spent ten times more on analytics software.
The other mistake I see constantly is treating analytics as a reporting task rather than a decision-making practice. Reports are not the goal. The goal is an action loop. You measure something, you learn from it, you change something, and you verify whether the change worked. That cycle is what analytics actually means for a small business. Everything else is just noise.
My honest advice: spend 30 minutes this week writing down your top three business goals and the one metric that best measures progress toward each. Then set up tracking for those three metrics only. You will learn more from that exercise than from any analytics course or platform demo.
— Tran
How Yourlocalseo helps small businesses use data to grow
Small business analytics does not exist in a vacuum. For local businesses in Pflugerville, Austin, Round Rock, and across Central Texas, the most valuable data often comes from local search performance, Google Business Profile activity, and on-page SEO signals.

Yourlocalseo builds local marketing strategies that are grounded in real data, not vanity metrics. We help nail salons, med spas, restaurants, and service businesses set up tracking that connects local search visibility to actual leads. From Google Business Profile optimization to on-page SEO and citation building, every service we provide is tied to measurable outcomes. If you are ready to build an analytics practice that drives real results for your local business, we are the partner to help you get there.
FAQ
What does analytics mean for a small business?
Analytics for a small business is the practice of measuring, capturing, and maintaining data to inform specific business decisions. It is a discipline, not a software category.
How many metrics should a small business track?
Most small businesses should track five core metrics: total visits, traffic sources, top pages, conversion rate, and engagement rate. Tracking fewer metrics consistently produces better decisions than monitoring a large number of metrics sporadically.
How often should I review my analytics data?
A 15-minute weekly review of your core metrics is the recommended minimum. Daily monitoring of short-term fluctuations creates noise and leads to reactive decisions rather than informed ones.
What is the growth analytics cycle?
The growth analytics cycle is a five-step process: measure, learn, decide, execute, and verify. Each step connects data to a specific business action and confirms whether that action produced the expected result.
Do I need a data analyst to use analytics effectively?
No. Small business owners can build an effective analytics practice using free tools, five core metrics, and a weekly review routine. The key requirement is discipline, not technical expertise.